
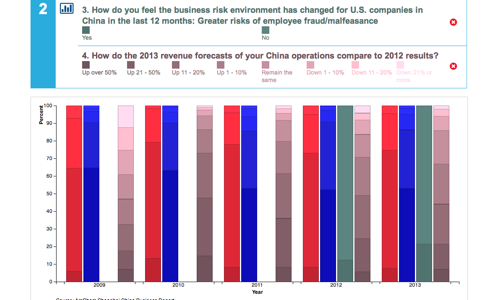
For AmCham Shanghai we designed and built the interactive version of their annual China Business Report(CBR). The app allows users to produce custom graphs of the results from the CBR for the past five years. Results can be filtered, for example by company, industry and market size. Using this app, users can drill down in to a lot of data and produce visualisations which are specific to their company and industry.
The app is written in JavaScript using React for interaction and D3 for drawing the graphs.
Head over to the CBR site and make your own graph.
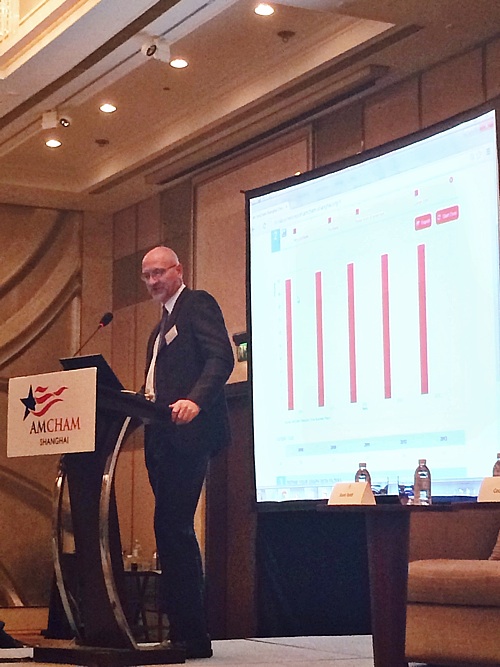
The photo above shows Kent Kedl of Control Risks introducing the interactive CBR at the launch event held in the Portman on 25 February 2014.